Wednesday, 9 September 2026

Technical Analysis Simulation Game


Master the Markets: Technical Analysis & Trading Simulator

The Quant Trader's Corner

Mastering Market Technicals, Price Action & Algorithmic Concepts

Test Your Trading Instincts: The Interactive Technical Analysis Simulator

Whether you are learning to trade the financial markets or testing out new technical analysis strategies, paper trading is the best way to hone your instincts without risking real capital. Below is an interactive, real-time trading canvas simulator that mimics realistic candlestick price movements, complete with major industry-standard indicators.

📈 Robust Charting & Trading Game
Balance $10,000.00
Position FLAT
Unrealized P&L $0.00
Win Rate 0%

How to Play & Game Controls

The objective of the game is simple: start with a theoretical seed balance of $10,000 and grow your portfolio by correctly reading market signals to place profitable trades.

  • Buy / Long: Open a long position when you anticipate price action will rise. You profit if you close the trade at a higher price than where you entered.
  • Sell / Short: Open a short position when you expect prices to drop. You profit if you buy back to close at a lower price.
  • Close Position: Exit your current open trade and realize your active profits or losses.
  • Next Candle ➔: Advance the chart time frame by exactly one candle to see how price evolves.
  • Auto Play ▶: Set the price chart to generate automated real-time ticks every 400 milliseconds to simulate live market volatility.

Understanding the Technical Indicators

The simulator features dynamic indicator calculation engine built directly on an HTML5 canvas layer. Toggling indicators from the toolbar allows you to isolate signals and test distinct technical setups:

EMA 20 (Cyan)

The 20-period Exponential Moving Average gives priority to recent price changes. It reacts swiftly to fast momentum shifts and short-term trends.

EMA 50 (Orange)

The 50-period EMA provides a broader trend baseline. Look for "Golden Crosses" (20 EMA crossing above 50 EMA) for bullish signals, or "Death Crosses" for bearish trends.

Bollinger Bands (Pink)

Consists of a 20-period moving average and standard deviation bands. When candles touch or breach the upper/lower bands, price is often considered overextended.

VWAP (Purple)

Volume-Weighted Average Price calculates the ratio of price to total volume traded. Institutional traders frequently use VWAP as a benchmark for fair market value.

Oscillators: Relative Strength Index (RSI)

Located directly underneath the main candlestick chart is the RSI (14) Sub-Panel. RSI measures the speed and magnitude of recent price moves on a scale from 0 to 100:

  • Above 70 (Dotted Line): Suggests overbought market conditions. Price may be due for a retracement or pull-back.
  • Below 30 (Dotted Line): Indicates oversold market conditions, signaling potential buying opportunities or bounce points.

Winning Strategies to Try

Try out these popular technical strategies in the simulator above:

  1. Bollinger Band Mean Reversion: Wait for a candle to stretch far outside the outer pink Bollinger Bands while RSI drops below 30 or exceeds 70. Enter a mean-reversion trade anticipating price returning to the center line.
  2. EMA Trend-Following Crossovers: Wait for the Cyan 20-EMA line to cross above the Orange 50-EMA line while price stays above the Purple VWAP line. Enter a Long position and ride the trend higher!

Sunday, 23 August 2026

Simulation Game - SPNE - Game Theory

 This is a simulation game to illustrate the Sub Game Perfect Nash Equilibrium concept in game theory:

This is an interactive simulation game designed to illustrate the Subgame Perfect Nash Equilibrium (SPNE) concept and Backward Induction in Game Theory.

📖 What is the Centipede Game?

The Centipede Game is a famous extensive-form dynamic game in game theory first introduced by economist Robert Aumann in 1981. Two players take turns deciding whether to "Take" (end the game and secure the larger share of the current pot) or "Pass" (pass the turn to the other player, causing the total pot to grow).

Key Concepts Demonstrated:

  • Subgame Perfect Nash Equilibrium (SPNE): A strategic equilibrium refinement where every player plays a Nash equilibrium in every subgame of the overall game.
  • Backward Induction: The analytical process of solving dynamic games by starting at the final decision node and working backward to determine optimal choices at each stage.
  • The Paradox of Backward Induction: Game theory dictates that rational players using backward induction will choose to Take on the very first move (resulting in the lowest overall payoff). However, experimental evidence shows human players frequently choose to Pass multiple times to build up higher collective rewards.

♟️ Centipede Game: SPNE & Backward Induction

Explore Sequential Dynamic Games, Subgames, and the Paradox of Backward Induction

$0
Player 1 Total
P1 Turn
Current State
$0
Player 2 Total

Node 1: Choose to Take (end game & take majority pot) or Pass (grow pot & pass turn).

🧠 Backward Induction Solver

Subgame Perfect Nash Equilibrium (SPNE) is found by solving the game backward from the terminal nodes.

Click the button above to trace subgames backward node-by-node.

Game History

Rnd End Node Action Payoffs (P1, P2)
SPNE & Backward Induction Simulator

♟️ Centipede Game: SPNE & Backward Induction

Explore Sequential Dynamic Games, Subgames, and the Paradox of Backward Induction

$0
Player 1 Total
P1 Turn
Current State
$0
Player 2 Total

Node 1: Choose to Take (end game & take majority pot) or Pass (grow pot & pass turn).

🧠 Backward Induction Solver

Subgame Perfect Nash Equilibrium (SPNE) is found by solving the game backward from the terminal nodes.

Click the button above to trace subgames backward node-by-node.

Game History

Rnd End Node Action Payoffs (P1, P2)

Tuesday, 4 November 2025

Derivatives - Mind Map

Wonder how a derivatives mind map looks like. Have a look at this notebookLM-generated image. This is an introduction to derivatives:


Game Theory-A Mind Map

 Here is a mind map on game theory I created with notebookLM: 


Friday, 24 October 2025

Commodity, Food Prices, and Inflation

These prices are published by a Kaggle user Lyle Begbie:

These charts capture the pulse of the global economy:


Tuesday, 20 May 2025

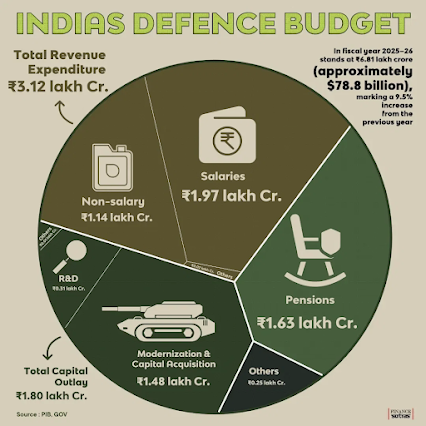
India's Defence Budget 2025-2026

The Indian defence budget has almost reached 7 trillion Rupees. Here is a breakup courtesy the Visual Capitalist:


Wednesday, 22 March 2023

Hedging with Futures Contracts

This video will help you understand hedging with futures contracts. A brief market outlook is also presented. Additionally, videos from experts in the domain are also featured: